Since you’re all isolated, grumpy and bored I’ve decided to create a little introduction to memory forensics. The test subject is the first stage of MemLabs, a set of CTF challenges focused on memory forensics by @_abhiramkumar. Each stage has its own memory dump that was taken from a live system using a tool like DumpIt. The goal for the first stage of MemLabs is to obtain all three flags.
Since we’re hip and cool, we’re using free and open source software for the analysis tasks. A very convenient and powerful tool for memory forensics is volatility. It’s a Python based memory forensics framework for all kinds of memory analyses - just have a look at the huge list of available analysis commands. It’s under active development by the Volatility Foundation, which has shared some introductory words in the wiki. Before you ask - yes it supports Windows, Linux and OSX memory dumps.
To get started quickly, a cheatsheet like this one may be helpful :)
Basic Image Analysis
Ok we have a memory dump, what now? The first thing to check is the type of OS the image originates from using volatility:
vol.py -f ./MemoryDump_Lab1.raw imageinfo
Volatility Foundation Volatility Framework 2.6.1
INFO    : volatility.debug    : Determining profile based on KDBG search...
          Suggested Profile(s) : Win7SP1x64, Win7SP0x64, Win2008R2SP0x64, Win2008R2SP1x64_24000
[...]
Seems like a Windows 7 machine.
Another volatility command lists all the processes that were running on the machine when the image was taken, just like magic:
vol.py  -f ./MemoryDump_Lab1.raw --profile=Win7SP1x64 pslist
Volatility Foundation Volatility Framework 2.6.1
Offset(V)          Name                    PID   PPID   Thds     Hnds   Sess  Wow64 Start                          Exit
------------------ -------------------- ------ ------ ------ -------- ------ ------ ------------------------------ ------------------------------
0xfffffa8000ca0040 System                    4      0     80      570 ------      0 2019-12-11 13:41:25 UTC+0000
[...]
0xfffffa80022199e0 svchost.exe            2368    484      9      365      0      0 2019-12-11 14:32:51 UTC+0000
0xfffffa8002222780 cmd.exe                1984    604      1       21      1      0 2019-12-11 14:34:54 UTC+0000
0xfffffa8002227140 conhost.exe            2692    368      2       50      1      0 2019-12-11 14:34:54 UTC+0000
0xfffffa80022bab30 mspaint.exe            2424    604      6      128      1      0 2019-12-11 14:35:14 UTC+0000
[...]
0xfffffa8000f4db30 dwm.exe                3004    852      5       72      2      0 2019-12-11 14:37:14 UTC+0000
0xfffffa8000f4c670 explorer.exe           2504   3000     34      825      2      0 2019-12-11 14:37:14 UTC+0000
[...]
0xfffffa8000ecea60 SearchFilterHo         1720    480      5       90      0      0 2019-12-11 14:37:21 UTC+0000
0xfffffa8001010b30 WinRAR.exe             1512   2504      6      207      2      0 2019-12-11 14:37:23 UTC+0000
0xfffffa8001020b30 SearchProtocol         2868    480      8      279      0      0 2019-12-11 14:37:23 UTC+0000
0xfffffa8001048060 DumpIt.exe              796    604      2       45      1      1 2019-12-11 14:37:54 UTC+0000
[...]
We can use this list of processes to map out some candidates for further analysis. Of course, DumpIt.exe can be ignored since it was called to create the analyzed image. The other interesting running processes are cmd.exe, mspaint.exe and WinRAR.exe.
Hint: You can also use the pstree command to show the process relationships using volatility.
Another cool thing that’s possible is creating “screenshots” from the memory dump:
mkdir shots && \
vol.py -f ./MemoryDump_Lab1.raw --profile=Win7SP1x64 screenshot --dump-dir=shots
Note that this only shows the general structure of the screen and not the actual contents. However, this may be helpful in a forensic case or if one needs some additional clues:
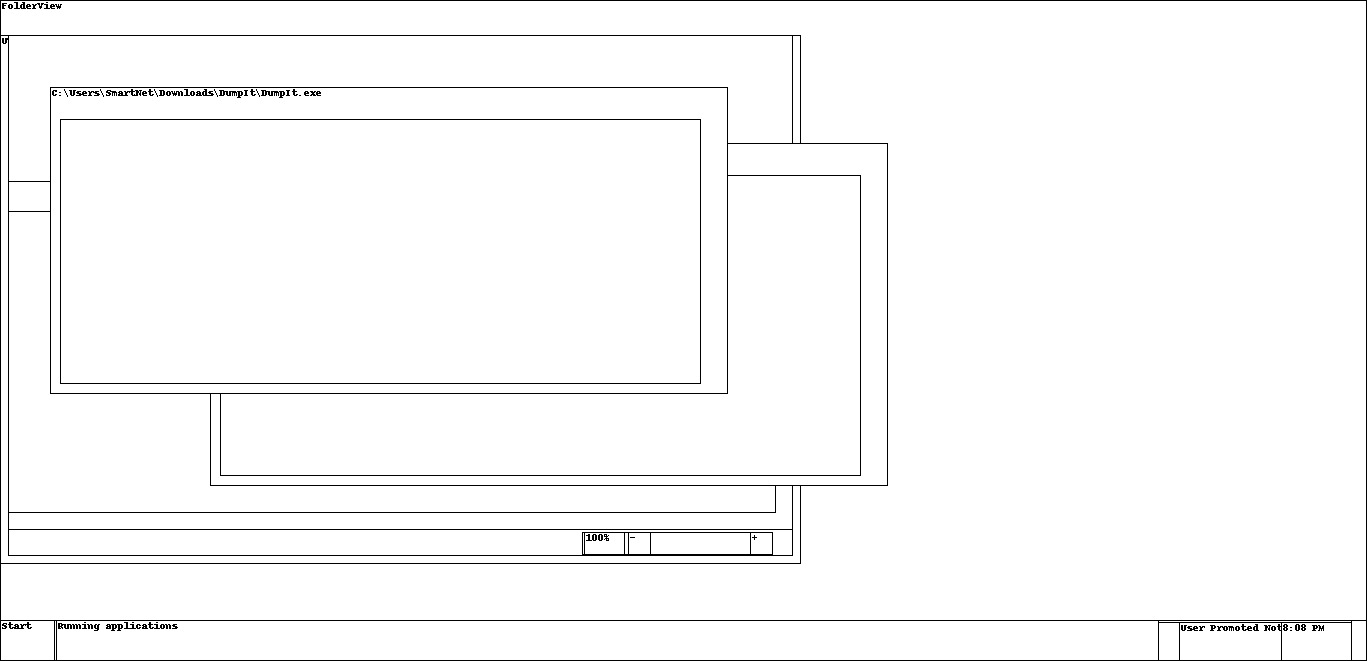
Considering this was reconstructed from a memory dump, I’d say that’s still pretty impressive. Now it’s time to analyze the candidates one after another.
Flag 1: cmd.exe
One particular analysis task for cmd.exe processes is to read the entire history, including the command outputs. Check this out:
vol.py  -f ./MemoryDump_Lab1.raw --profile=Win7SP1x64 consoles
Volatility Foundation Volatility Framework 2.6.1
**************************************************
ConsoleProcess: conhost.exe Pid: 2692
Console: 0xff756200 CommandHistorySize: 50
HistoryBufferCount: 1 HistoryBufferMax: 4
OriginalTitle: %SystemRoot%\system32\cmd.exe
Title: C:\Windows\system32\cmd.exe - St4G3$1
AttachedProcess: cmd.exe Pid: 1984 Handle: 0x60
----
CommandHistory: 0x1fe9c0 Application: cmd.exe Flags: Allocated, Reset
CommandCount: 1 LastAdded: 0 LastDisplayed: 0
FirstCommand: 0 CommandCountMax: 50
ProcessHandle: 0x60
Cmd #0 at 0x1de3c0: St4G3$1
----
Screen 0x1e0f70 X:80 Y:300
Dump:
Microsoft Windows [Version 6.1.7601]
Copyright (c) 2009 Microsoft Corporation.  All rights reserved.

C:\Users\SmartNet>St4G3$1
ZmxhZ3t0aDFzXzFzX3RoM18xc3Rfc3Q0ZzMhIX0=
[...]
And there’s the first flag:
echo -ne "ZmxhZ3t0aDFzXzFzX3RoM18xc3Rfc3Q0ZzMhIX0=" | base64 -d
flag{th1s_1s_th3_1st_st4g3!!}
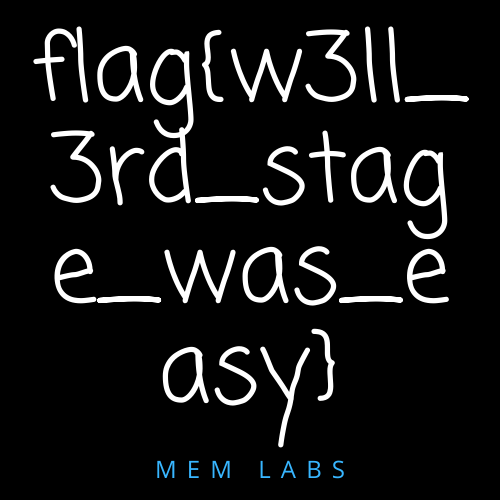
Flag 2: mspaint.exe
This is my favorite one. It’s possible to reconstruct the image shown in Paint from the memory dump using a 1337 hacker tool called gimp. Here’s how to do it:
- Dump the process memory of
mspaint.exeusing this command and the process ID2424:
vol.py -f MemoryDump_Lab1.raw --profile=Win7SP1x64 memdump -p 2424 -D .
-
Afterwards, just rename the created file
2424.dmpto2424.datain order to makegimprecognize it as raw image data. -
Open it in
gimpand have patience: It’s required to figure out the correct width, height and offset in the image dialog to display the image properly:
As you can see, the values don’t have to be 100 percent accurate though. Flip and mirror the image get the second flag:

Ok that handwriting is awful.
Flag 3: WinRAR.exe
Considering WinRAR was running on the machine, the obvious thing to do is to scan the memory dump for archive files. Of course volatility can do this out of the box:
vol.py -f MemoryDump_Lab1.raw --profile=Win7SP1x64 filescan | egrep "zip|rar|7z"
Volatility Foundation Volatility Framework 2.6.1
[...]
0x000000003fb48bc0      1      0 R--r-- \Device\HarddiskVolume2\Users\Alissa Simpson\Documents\Important.rar
[...]
The Important.rar file seems to be important. Just extract it by specifying the correct offset:
vol.py -f MemoryDump_Lab1.raw --profile=Win7SP1x64 dumpfiles -Q 0x000000003fb48bc0 -D . && \
mv file.None.0xfffffa8001034450.dat flag.rar
Inside of the rar file, there’s a hint that says:
Password is NTLM hash(in uppercase) of Alissa's account passwd.
Well OK, let’s use volatility to dump the LM/NTLM hashes directly from memory:
vol.py -f MemoryDump_Lab1.raw --profile=Win7SP1x64 hashdump
Volatility Foundation Volatility Framework 2.6.1
Administrator:500:aad3b435b51404eeaad3b435b51404ee:31d6cfe0d16ae931b73c59d7e0c089c0:::
Guest:501:aad3b435b51404eeaad3b435b51404ee:31d6cfe0d16ae931b73c59d7e0c089c0:::
SmartNet:1001:aad3b435b51404eeaad3b435b51404ee:4943abb39473a6f32c11301f4987e7e0:::
HomeGroupUser$:1002:aad3b435b51404eeaad3b435b51404ee:f0fc3d257814e08fea06e63c5762ebd5:::
Alissa Simpson:1003:aad3b435b51404eeaad3b435b51404ee:f4ff64c8baac57d22f22edc681055ba6:::
Seems like the correct password is F4FF64C8BAAC57D22F22EDC681055BA6. The flag can then be found inside of the decrypted archive:
And that’s it for the first stage. Now go and have fun with the remaining stages. Have a look at some additional plugins, you may need them.
@carloz_spicy